Instrumentation, logging and debugging applications
Overview
In software engineering, logging and instrumentation are two different techniques used to monitor and debug applications.
Logging is the process of recording events that occur in an application. These events can include error messages, warnings, and other information that can be used to diagnose problems. Logging is typically used to capture information about what has happened in the past. It is a way to store data that can be analysed later to understand what went wrong.
Instrumentation, on the other hand, is the process of adding code to an application to collect data about its behaviour. This data can include metrics, events, logs, and traces. Instrumentation is used to capture information about what is happening in real-time. It is a way to monitor an application and understand how it is performing. Instrumentation also offers a way to easily provide cross process and domain boundaries,
[!Note] This document does not provide an indepth look at instrumentation prinipals but instead concentrates on how to output instrumentation using the Variant platform.
Azure Application Insights for data collection
Once information has been collected it has to be stored or logged. Variant uses Azure's monitoring services Application Insights to store this data and is normally automatically configured when deploying applications using the app settings: APPLICATIONINSIGHTS_CONNECTION_STRING. This can be overridden in your settings to point to any App Insight instance in any Azure subscription.
Instrumentation
Adding instrumentation using activities
Activities are core to adding instrumentation to applications and as the storage of logs and instrumentation is already configured in the application, in Variant its as simple as adding the ACTIVITY_NAME setting to either a connector or pipe. Doing this provides us with 3 different types of instrumentation categories:
- Basic instrumentation
- Domain specific instrumentation
- Http instrumentation
Basic Instrumentation
If we look at the following we can see that all we have done is added the activity name to the end point and 2 pipes.
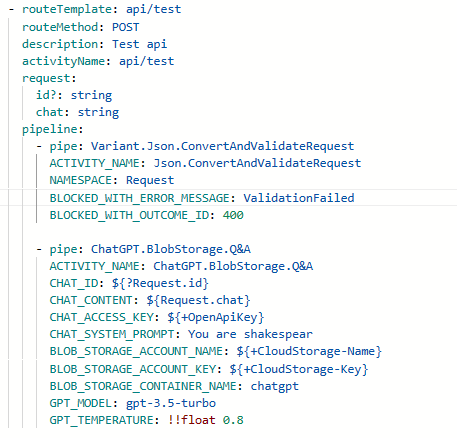
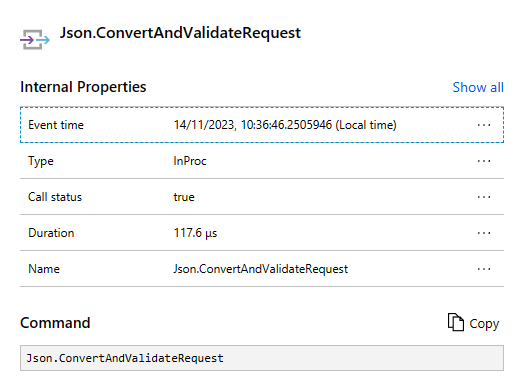
In Application insights the following information is stored:

With the Json.ConvertAndV alidateRequest storing the basic information
Although this is helpful for flow it can be improved slight by adding additional information
Adding Domain specific Information
Adding custom properties is done via the Variant.Core.UpdateActivityTraceStrategyPipe with the properties seen below
      - pipe: Variant.Core.UpdateActivityTraceStrategyPipe
        # Allows the storage of an activities status code
        ACTIVITY_STATUS_CODE: null
        # These are the custom properties and are stored as key/value pairs
        TAGS: null
        # This is the baggage and again stored as key/value pairs
        BAGGAGE: null
If we take the previous example if might be useful if we stored the request and response data as well. This can be done by adding the following pipe to the end of the pipeline:
  - pipe: Variant.Core.UpdateActivityTraceStrategyPipe
	TAGS:
	  chat: ${Request.chat}
	  id: ${?Request.id}
	  responseChat: ${Response.response}
	  responseId: ${Response.id}
This then gives us the following information in the logs:
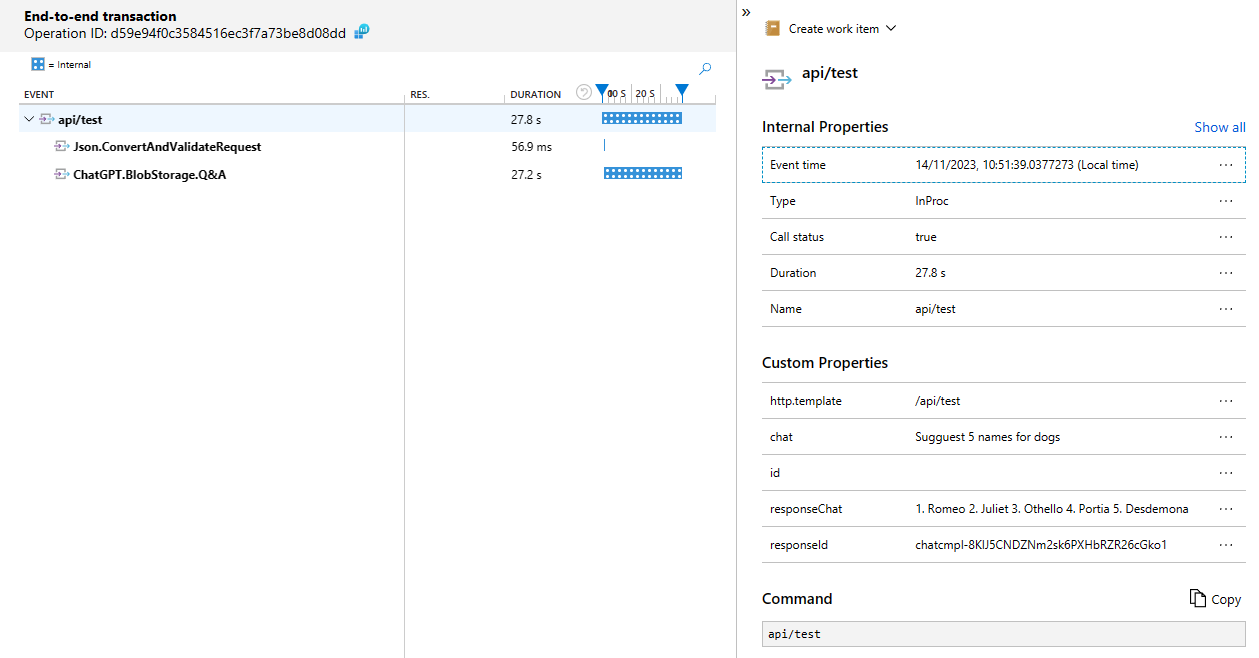
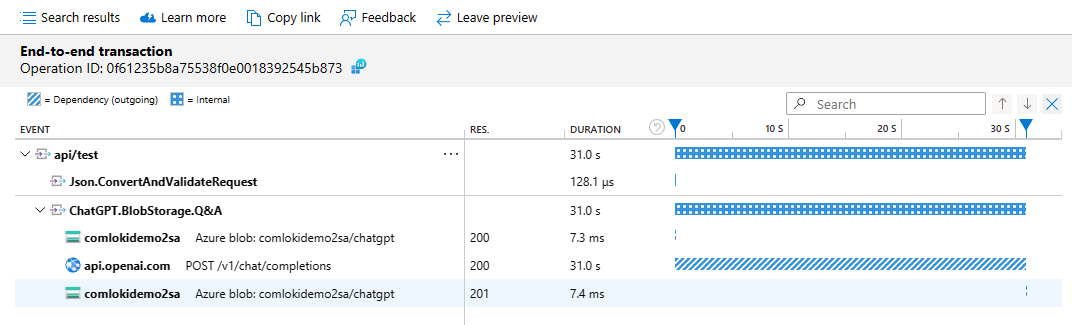
[!Note] The above example shows us the benefits of instrumentation. As we can see that the actual call took over 28 seconds to return. If we look at the output we can see it was the call to ChatGpt which took the majority of the time.
Adding Http instrumentation
Although we now have good domain specific instrumentation we can provide extra information on every HTTP call that is made during our request. To do this we need ensure the 'Variant.Instrumentation.AddHttpClient' setting is set to true as below (default is false):
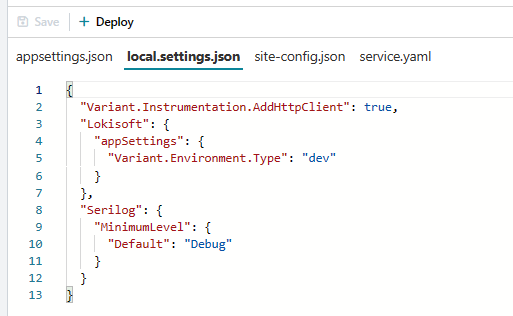
Now when we call the service we get the following trace created:
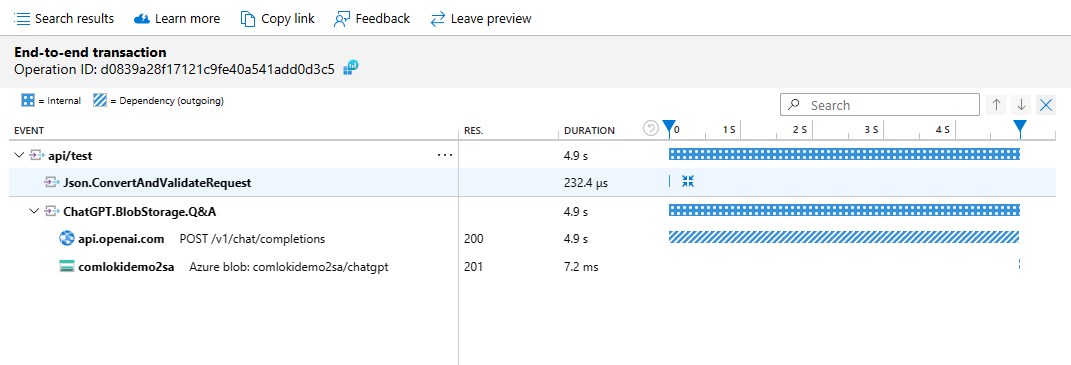
This now shows that are out ChatGPT call performs 2 Http client calls to booth the ChatGPT API endpoint and then to an Azure Storage blob container to store the conversation. If we add an id to the request we can see that it first makes a call to return the conversation from storage before calling the endpoint :
Logging and debugging
In Variant there are 2 pipes whcih are used for logging and debugging applications. These are:
- Variant.Core.LoggerPipe
- Variant.Core.LogDiagnosticsPipe
Variant.Core.LoggerPipe
This pipe, as well as it's derivative pipe 'Variant.Core.LogMessagePipe', are used to log any information and at any logging level to the logs. These can be placed anywhere and can log any data found in the current message. Their implementations are:
	#
	# Prefer to use the Variant.Core.LogMessagePipe instead
	# as this pipes signiture is built from a .NET implmentation
	#
  - key: Variant.Core.LoggerPipe
    value:
      type:  Variant.Strategies.Core.LoggerPipe, Variant.Strategies.Core, Version=1.0.0.0, Culture=neutral, PublicKeyToken=null
      replacements:
        LOG_MESSAGE:
        LOG_MESSAGE_PARAMETERS:
        INSTANCE_NAME:
        ACTIVITY_NAME:
        IS_ENABLED:
        LOG_LEVEL: Debug

  - key: Variant.Core.LogMessagePipe
    value:
        pipe: Variant.Core.LoggerPipe
        replacements:
            LOG_MESSAGE: null
            LOG_MESSAGE_PARAMETERS: []
            LOG_LEVEL: Debug
The main settings of these pipes are:
The LOG_MESSAGE setting can be any string value and can contain substitutions
The LOG_MESSAGE_PARAMETERS is an array of string values that allows data collectors i.e. App Insights, to store these parameters defined in the LOG_MESSAGE separately to the message. This allows log messages to be searched and filtered based on the parameter values.
The LOG_LEVEL determines what to log based on the applications Logging level. The allowed values are:
- Trace
- Debug
- Information
- Warning
- Error
- Critical
[!Tip] Wherever possible use the LOG_MESSAGE_PARAMETERS in conjunction with the LOG_MESSAGE
Here are a couple of examples on how to log message with and without the message parameters setting:
     - pipe: Variant.Core.LogMessagePipe
       LOG_LEVEL: Debug
       LOG_MESSAGE: The current time is ${DateTime.Now}

       # Note when uses the parameters setting there is no '$' prefix before the '{'
       # This is because its not a Variant substitution value but Microsoft's logger library
     - pipe: Variant.Core.LogMessagePipe
       LOG_LEVEL: Debug
       LOG_MESSAGE: The current time is {CurrentTime}
       LOG_MESSAGE_PARAMETERS:
        - ${DateTime.Now}
Variant.Core.LogDiagnosticsPipe
This pipe, as well as it's derivatives are used purely for debugging when developing applications. Its use is for outputting the current message headers and body (if required) to either the console or, in the case of an API call as the response stream.
The values of this pipe and its derivatives are as follows:
    # Prefer to use the derivitives of this pipe rather than this pipe itself
  - key: Variant.Core.LogDiagnosticsPipe
    value:
      type:  Variant.Strategies.Core.LogDiagnosticsPipe, Variant.Strategies.Core, Version=1.0.0.0, Culture=neutral, PublicKeyToken=null
      replacements:
        INSTANCE_NAME:
        ACTIVITY_NAME:
        IS_ENABLED:
        LOG_PAYLOAD: False
        LOG_MESSAGE_TO_CONSOLE: False
        SET_RESPONSE_TO_MESSAGE: False

 - key: Variant.Core.ReturnMessageLogPipe
    value:
        pipe: Variant.Core.LogDiagnosticsPipe
        IS_ENABLED: ${Variant.Environment.Type} == "dev"
        LOG_PAYLOAD: true
        SET_RESPONSE_TO_MESSAGE: true


  - key: Variant.Core.LogToConsolePipe
    value:
        pipe: Variant.Core.LogDiagnosticsPipe
        IS_ENABLED: ${Variant.Environment.Type} == "dev"
        LOG_PAYLOAD: False
        LOG_FOR_CONSOLE: true
[!Note] Both the Variant.Core.ReturnMessageLogPipe and Variant.Core.LogToConsolePipe are removed from all pipelines if the environment type is not dev
Variant.Core.ReturnMessageLogPipe
When developing API endpoints there may be times where you need to know what the state of the message is, or what variables are available, at a certain time. If you add the following pipe to any part of the message the pipeline will stop processing that message and return the message values as the Response object immediately:
- pipe: Variant.Core.ReturnMessageLogPipe
The return value of the any process calling this API now recieves the contents something like this:
Variant Message Diagnostic Data:
    MessageId:    b97a20b5-2bc2-418b-971d-35431eaa527c
    ThreadId: 17
    PartCount: {
    {
        0
    }
}1
    UniteMessage Context
    _ApiValidators : System.Collections.Generic.List`1[Variant.Strategies.Core.ValidatorItem
]
    Defaults       :
    Message.Id     : b97a20b5-2bc2-418b-971d-35431eaa527c
    Request.Header.Accept: */*
    Request.Header.Accept-Encoding: System.String[]
    Request.Header.client-ip: 90.152.4.252:10202
    Request.Header.Content-Length: 115
    Request.Header.Content-Type: text/plain
    Request.Header.disguised-host: com-lokidemo2-new-lmk9vxn0-fa.azurewebsites.net
    Request.Header.Enumerator: System.Net.Http.Headers.HttpHeaders+<GetEnumeratorCore>d__24
    Request.Header.Host: com-lokidemo2-new-lmk9vxn0-fa.azurewebsites.net
    Request.Header.Max-Forwards: 10
    Request.Header.Method: POST
    Request.Header.postman-token: 76ac55b1-dd6f-438a-adf9-35c14c5ead88
    Request.Header.Scheme: https
    Request.Header.User-Agent: PostmanRuntime/7.35.0
    Request.Header.was-default-hostname: com-lokidemo2-new-lmk9vxn0-fa.azurewebsites.net
    Request.Header.x-appservice-proto: https
    Request.Header.x-arr-log-id: 87c0e0f6-a98a-4b00-9fec-79056f6aea34
    Request.Header.x-arr-ssl: 2048|256|CN=Microsoft Azure TLS Issuing CA 01, O=Microsoft Corporation, C=US|CN=*.azurewebsites.net, O=Microsoft Corporation, L=Redmond, S=WA, C=US
    Request.Header.x-forwarded-for: 90.152.4.252:10202
    Request.Header.x-forwarded-proto: https
    Request.Header.x-forwarded-tlsversion: 1.2
    Request.Header.x-original-url: /api/test
    Request.Header.x-site-deployment-id: com-lokidemo2-new-lmk9vxn0-fa
    Request.Header.x-waws-unencoded-url: /api/test
    Request.Property.AbsolutePath: /api/test
    Request.Property.LocalPath: /api/test
    Request.Property.Url: https://com-lokidemo2-new-lmk9vxn0-fa.azurewebsites.net/api/test
    Request.Query  :

 -------------------- 'Primary' Details----------------------------------
    PartName: 'Primary' ContextEmpty
    PartName: 'Primary        ' Data type: System.IO.MemoryStream
    PartName: 'Primary        ' Data: {{
    "id": "chatcmpl-8KlyVs3en51eFFj8CgYNB7Rq8Hnkg",
    "chat":"provide explainations of each name"
}}
 ----------------- End of 'Primary' Details-------------------------------
Variant.Core.LogToConsolePipe
If the call is not an API or you want to allow the call to continue you can use this pipe as follows and will output the same diagnostics data as above to the logs:
  - pipe: Variant.Core.LogToConsolePipe
    LOG_PAYLOAD: false
However, care must taken when setting the LOG_PAYLOAD setting to true as the pipe will automatically convert the payload to a string and it will remain that type for all following calls. A example of this is that if the payload was a Stream and a stream was expected in a following pipe then an error would be raised.